Virtualization monitoring tools are essential for maintaining the performance and stability of IT infrastructures.
They help track resource usage, detect issues, and optimize virtual environments.
This guide covers the 10 best virtualization monitoring tools for 2025, with key features, pricing, and use cases for each.
Whether you’re managing a small setup or a large enterprise, here’s a quick overview of the tools:
- NinjaOne: Real-time monitoring, centralized management, and automation for VMware and Hyper-V.
- ManageEngine OpManager: Detailed insights for VMware, Hyper-V, Citrix, and Nutanix platforms.
- New Relic: AI-powered analytics for hybrid cloud and virtual infrastructures.
- SolarWinds Virtualization Manager: User-friendly dashboards and resource optimization.
- Dynatrace: AI-driven full-stack monitoring and automated anomaly detection.
- Nagios XI: Open-source monitoring with customizable plugins and scalability.
- eG Enterprise: Multi-hypervisor support and root cause analysis.
- Syskit Monitor: Focused on Citrix and Windows virtual desktops.
- Site24x7: AI-driven analysis for VMware, Hyper-V, and Citrix environments.
- Zabbix: Free, open-source solution for large-scale monitoring.
I partner with awesome companies that offer products that help my readers achieve their goals! If you purchase through my partner links, I get paid for the referral at no additional cost! For more information, visit my disclosure page.
Quick Comparison
| Tool | Platforms Supported | Key Features | Pricing Starting Point |
|---|---|---|---|
| NinjaOne | VMware, Hyper-V | Automation, real-time monitoring | Custom pricing |
| ManageEngine | VMware, Hyper-V, Citrix | Alerts, dashboards, scalability | $245 (Standard Edition) |
| New Relic | VMware, Cloud VMs | AI-powered analytics, integrations | $49/month |
| SolarWinds VM | VMware, Hyper-V | Resource optimization, alerts | $1,813 (perpetual) |
| Dynatrace | Multi-platform | AI-driven monitoring, full-stack | Consumption-based |
| Nagios XI | VMware, Hyper-V, Citrix | Open-source, customizable plugins | $1,995 (Standard) |
| eG Enterprise | All major platforms | Root cause analysis, storage metrics | $100/month |
| Syskit Monitor | Citrix, Windows | User session analytics | $359/year |
| Site24x7 | Multi-platform | AI-driven insights, capacity planning | $9/month |
| Zabbix | All major platforms | Free, scalable, customizable | Free |
This list provides a variety of options based on organization size, budget, and technical requirements. Continue reading for detailed comparisons and recommendations.
1. NinjaOne
NinjaOne is a powerful tool for managing endpoints, designed with a focus on virtualization monitoring. It works seamlessly with VMware and Hyper-V setups, combining virtual machine and physical infrastructure monitoring in one platform.
Key Features:
- Real-time monitoring of host machines
- Tracking performance thresholds
- Automated alerts and notifications
- Detailed infrastructure reports for clients
- Centralized management for virtual machines
With its automation engine, NinjaOne claims to improve IT efficiency by 95% while reducing ticket volumes and resolution times by 94%.
A notable success story comes from Zero Latency VR, which operates over 50 venues in 23 countries. Scott Human shared:
“NinjaOne provided peace of mind by allowing them to innovate rapidly, respond to issues proactively, and deliver support to customers in a way that sets them apart in the industry.”
The platform boasts a 98% customer satisfaction score (CSAT). While pricing details aren’t publicly disclosed, you can try NinjaOne with a 14-day free trial.
Performance Monitoring Highlights:
| Feature | What It Does |
|---|---|
| Host Monitoring | Tracks host machine metrics and health in real-time |
| Guest VM Management | Provides centralized control and monitoring for virtual machines |
| Automation | Handles routine tasks and resolves issues automatically |
| Reporting | Generates detailed reports with customizable metrics |
| Alert System | Sends proactive notifications based on set thresholds |
For teams looking to simplify virtualization monitoring and save costs, NinjaOne offers a way to reduce vulnerabilities by up to 75% with its automated tools. As one of the standout virtualization monitoring solutions of 2025, it sets a high bar for managing performance. Up next, we’ll dive into what makes ManageEngine OpManager a strong competitor in this field.
2. ManageEngine OpManager
ManageEngine OpManager provides detailed insights into the performance of virtual infrastructures. With ratings of 4.5/5 on G2 and 4.6/5 on Capterra, it’s recognized for its monitoring features and reliable customer support.
Key Features
This platform tracks performance across VMware, Hyper-V, Citrix, and Nutanix systems, monitoring critical metrics like CPU usage, memory consumption, I/O operations, network activity, and disk usage.
| Monitoring Aspect | Features |
|---|---|
| Virtual Infrastructure | Real-time monitoring of VMs, hosts, clusters |
| Physical Resources | Tracks server, network, and storage health |
| Alert System | Notifications via email, SMS, and integrations |
| Reporting | Custom dashboards and performance reports |
| Platform Compatibility | Supports VMware, Hyper-V, Citrix, Nutanix |
Pricing Details
- Standard Edition: Starts at $245 for 25 devices
- Enterprise Edition: Priced at $11,545 for 250 devices
- Professional Edition: Custom pricing between the two tiers
Performance and Troubleshooting Tools
ManageEngine OpManager stands out with its automated troubleshooting and centralized dashboard. Some of its most useful features include:
- Automatic discovery and mapping of virtual assets
- Real-time performance tracking with threshold alerts
- Built-in troubleshooting tools for faster issue resolution
- Fully customizable alerting and notification system
However, the platform does come with a learning curve, especially during setup. It’s designed for IT professionals who are ready to dive into its advanced functionality.
Up next, we’ll take a look at how New Relic approaches virtualization monitoring with its own toolset.
3. New Relic
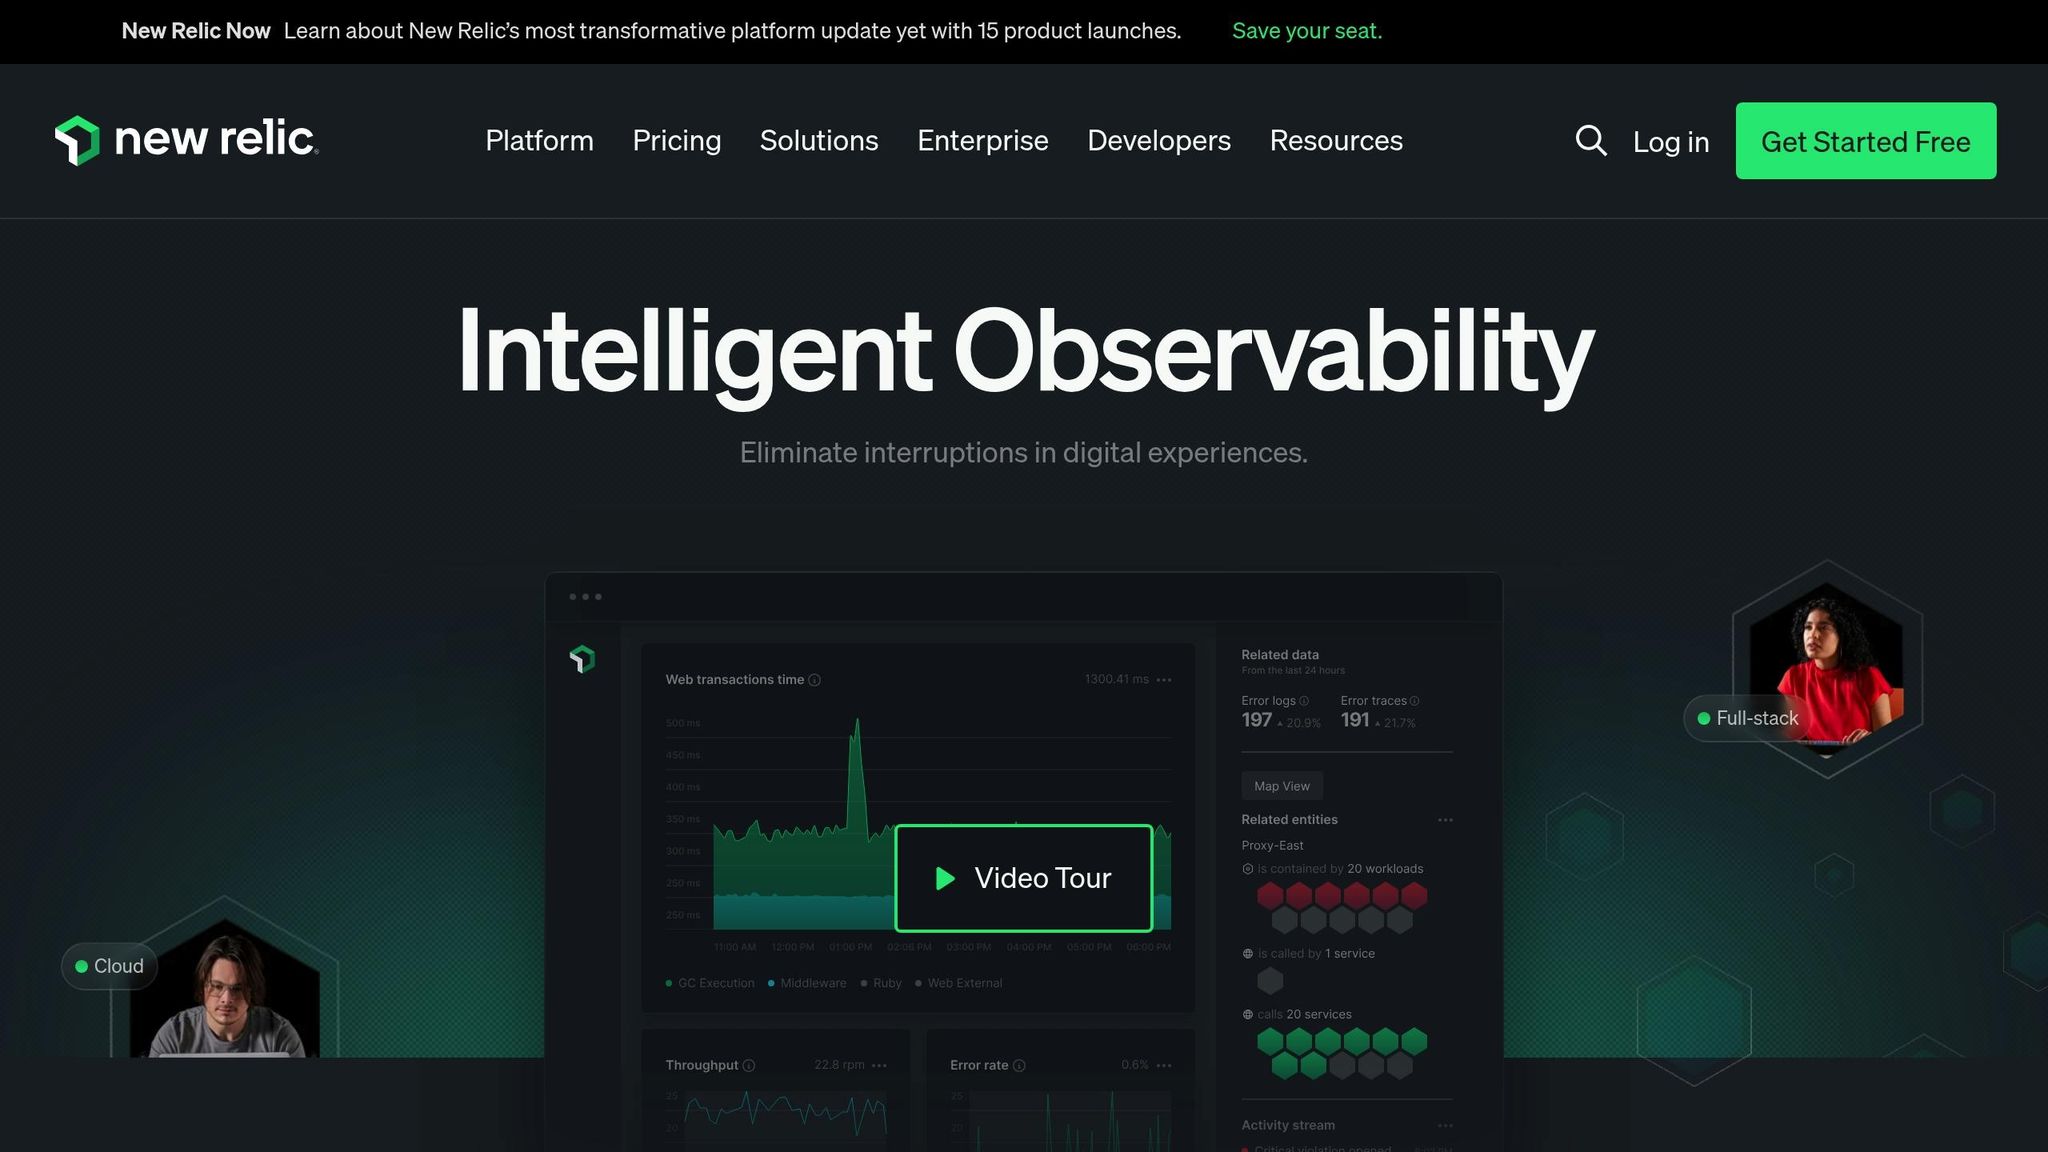
New Relic is a top choice for virtualization monitoring, offering an observability platform that has earned a 4.5/5 rating on Gartner Peer Insights from over 2,000 reviews. It simplifies monitoring for both virtual and physical infrastructures by combining data from VMware, Hyper-V, and AWS environments into one unified platform.
Key Features and Performance
New Relic combines infrastructure metrics with application performance data, using AI-powered analytics to speed up issue detection and resolution. Here’s how it impacts performance:
| Performance Metric | Benefit |
|---|---|
| Mean Time to Detect (MTTD) | 50% faster |
| Mean Time to Resolve (MTTR) | 30% faster |
| User Satisfaction | 90% of users recommend it |
The platform provides real-time alerts and advanced analytics to track VM performance, resource usage, and application behavior.
Pricing Structure
| Plan | Starting Price | Data Allowance |
|---|---|---|
| Standard | $49/month | 100 GB |
| Pro | $99/month | 100 GB |
| Enterprise | Custom pricing | Flexible |
Integration and Implementation
New Relic works seamlessly with major virtualization platforms and third-party tools. It monitors:
- Virtual machine performance
- Host resource usage
- Network throughput
- Storage performance
- Application dependencies
This platform is ideal for organizations that need a complete view of their tech stack, especially those managing hybrid cloud environments. Up next, we’ll take a look at SolarWinds Virtualization Manager and its performance management capabilities.
4. SolarWinds Virtualization Manager
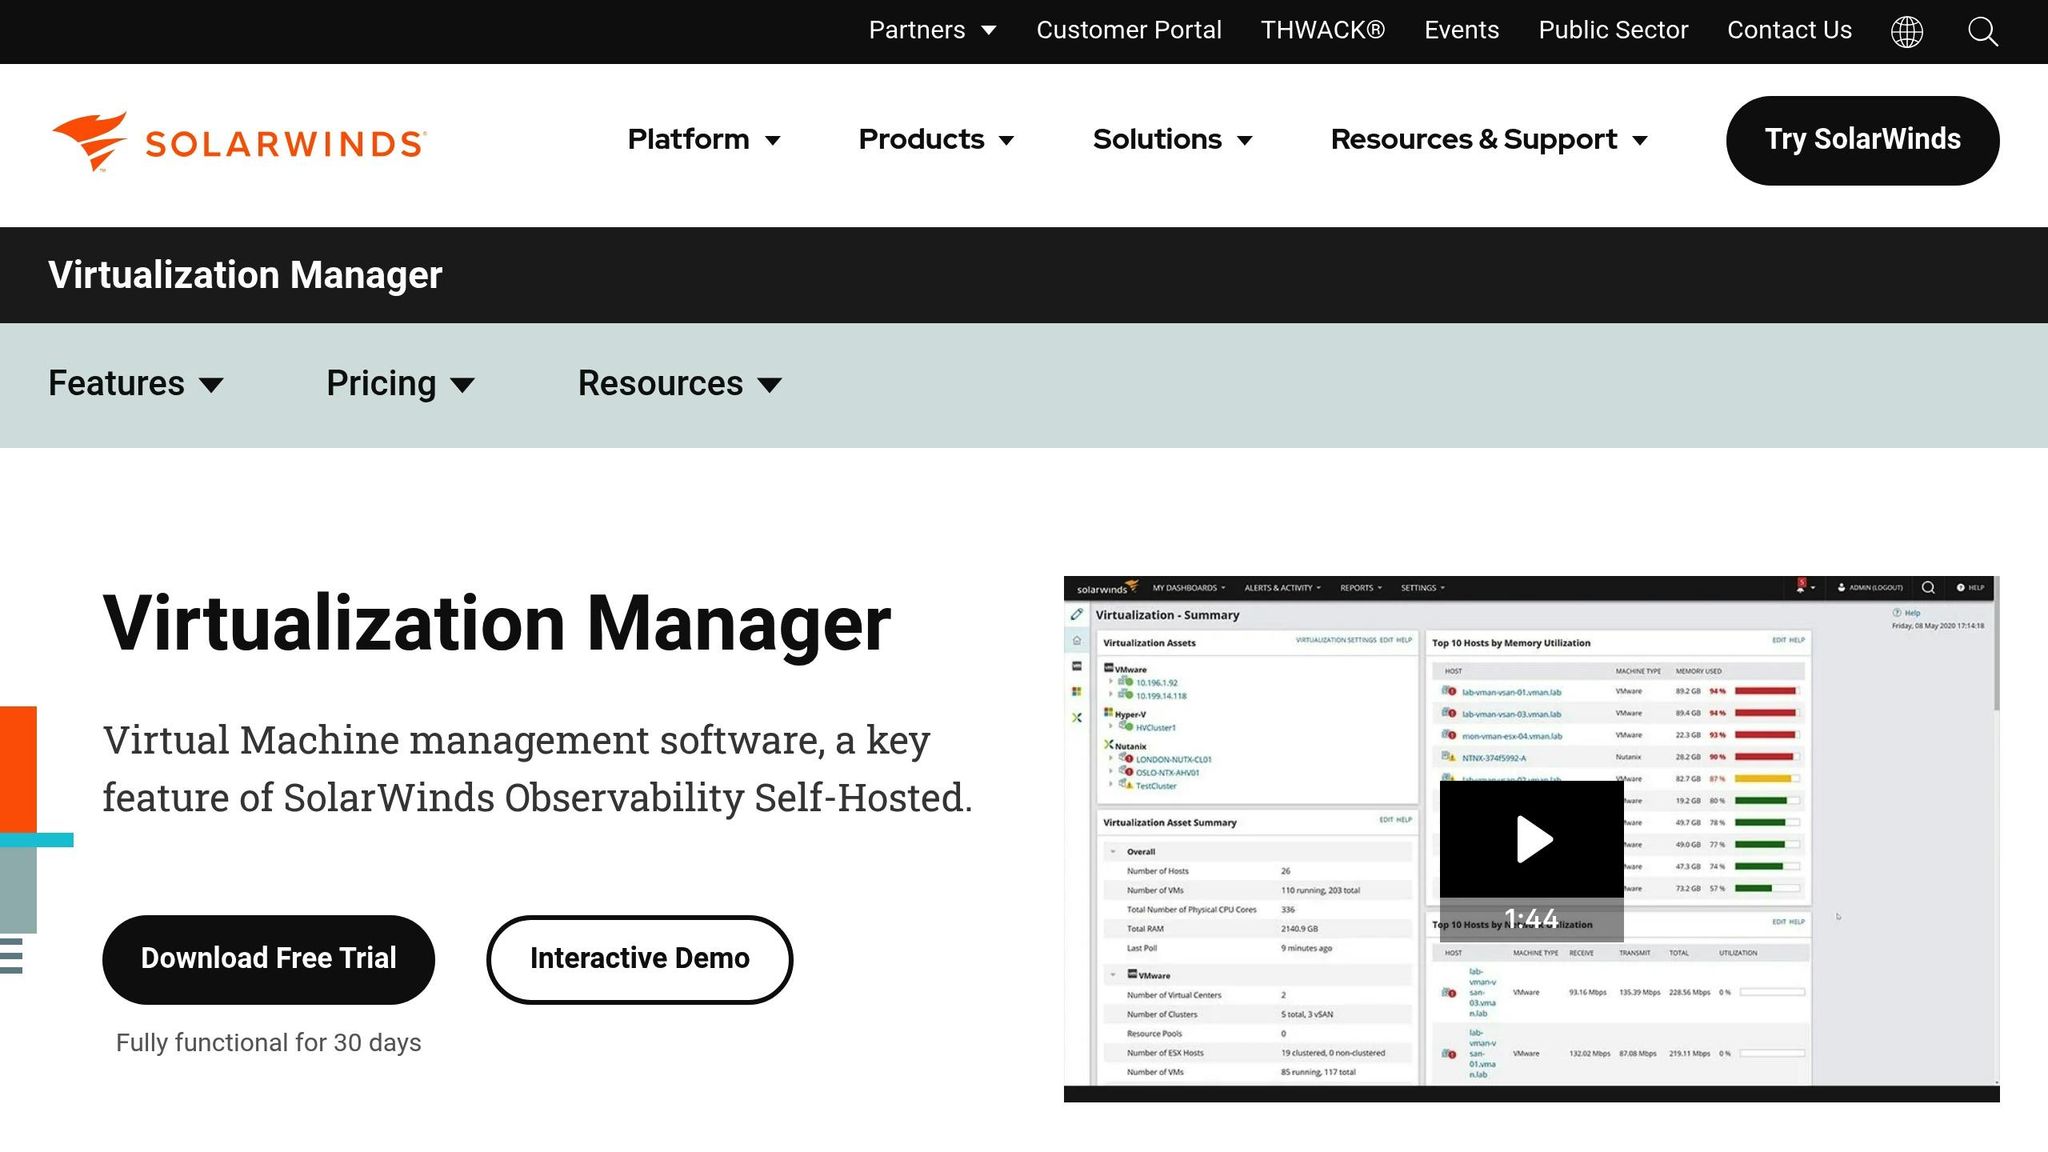
SolarWinds Virtualization Manager is a monitoring tool that provides a centralized view of VMware and Hyper-V environments. It holds a 4.5/5 rating on both Gartner Peer Insights and TrustRadius, highlighting its strong reputation among users.
Core Capabilities
The platform includes a user-friendly dashboard with drag-and-drop functionality and pre-configured templates, making setup quick and simple.
| Feature Category | Capabilities |
|---|---|
| Performance Monitoring | Tracks real-time VM metrics, monitors resource usage, and aids in capacity planning. |
| Management Tools | Offers automated alerts and tools for resource optimization. |
| Integration Options | Works seamlessly with SolarWinds SAM and the Orion Platform. |
| Environment Support | Compatible with VMware and Hyper-V environments. |
Resource Optimization
The tool provides in-depth insights to pinpoint underutilized resources, improve VM placement, and address potential performance bottlenecks before they escalate.
Business Impact
For enterprises, SolarWinds Virtualization Manager delivers:
| Benefit | Impact |
|---|---|
| Proactive Monitoring | Minimizes downtime by catching issues early. |
| Resource Planning | Prevents overprovisioning and ensures efficient resource use. |
| Unified Management | Simplifies operations across different virtualization platforms. |
| Performance Analytics | Enables smarter infrastructure decisions with real-time data. |
Pricing
The pricing is based on a socket-based licensing model, with options for either perpetual or subscription plans. This flexibility makes it a practical choice for enterprises, especially those already using SolarWinds tools.
Up next, we’ll explore how Dynatrace approaches virtualization monitoring.
5. Dynatrace
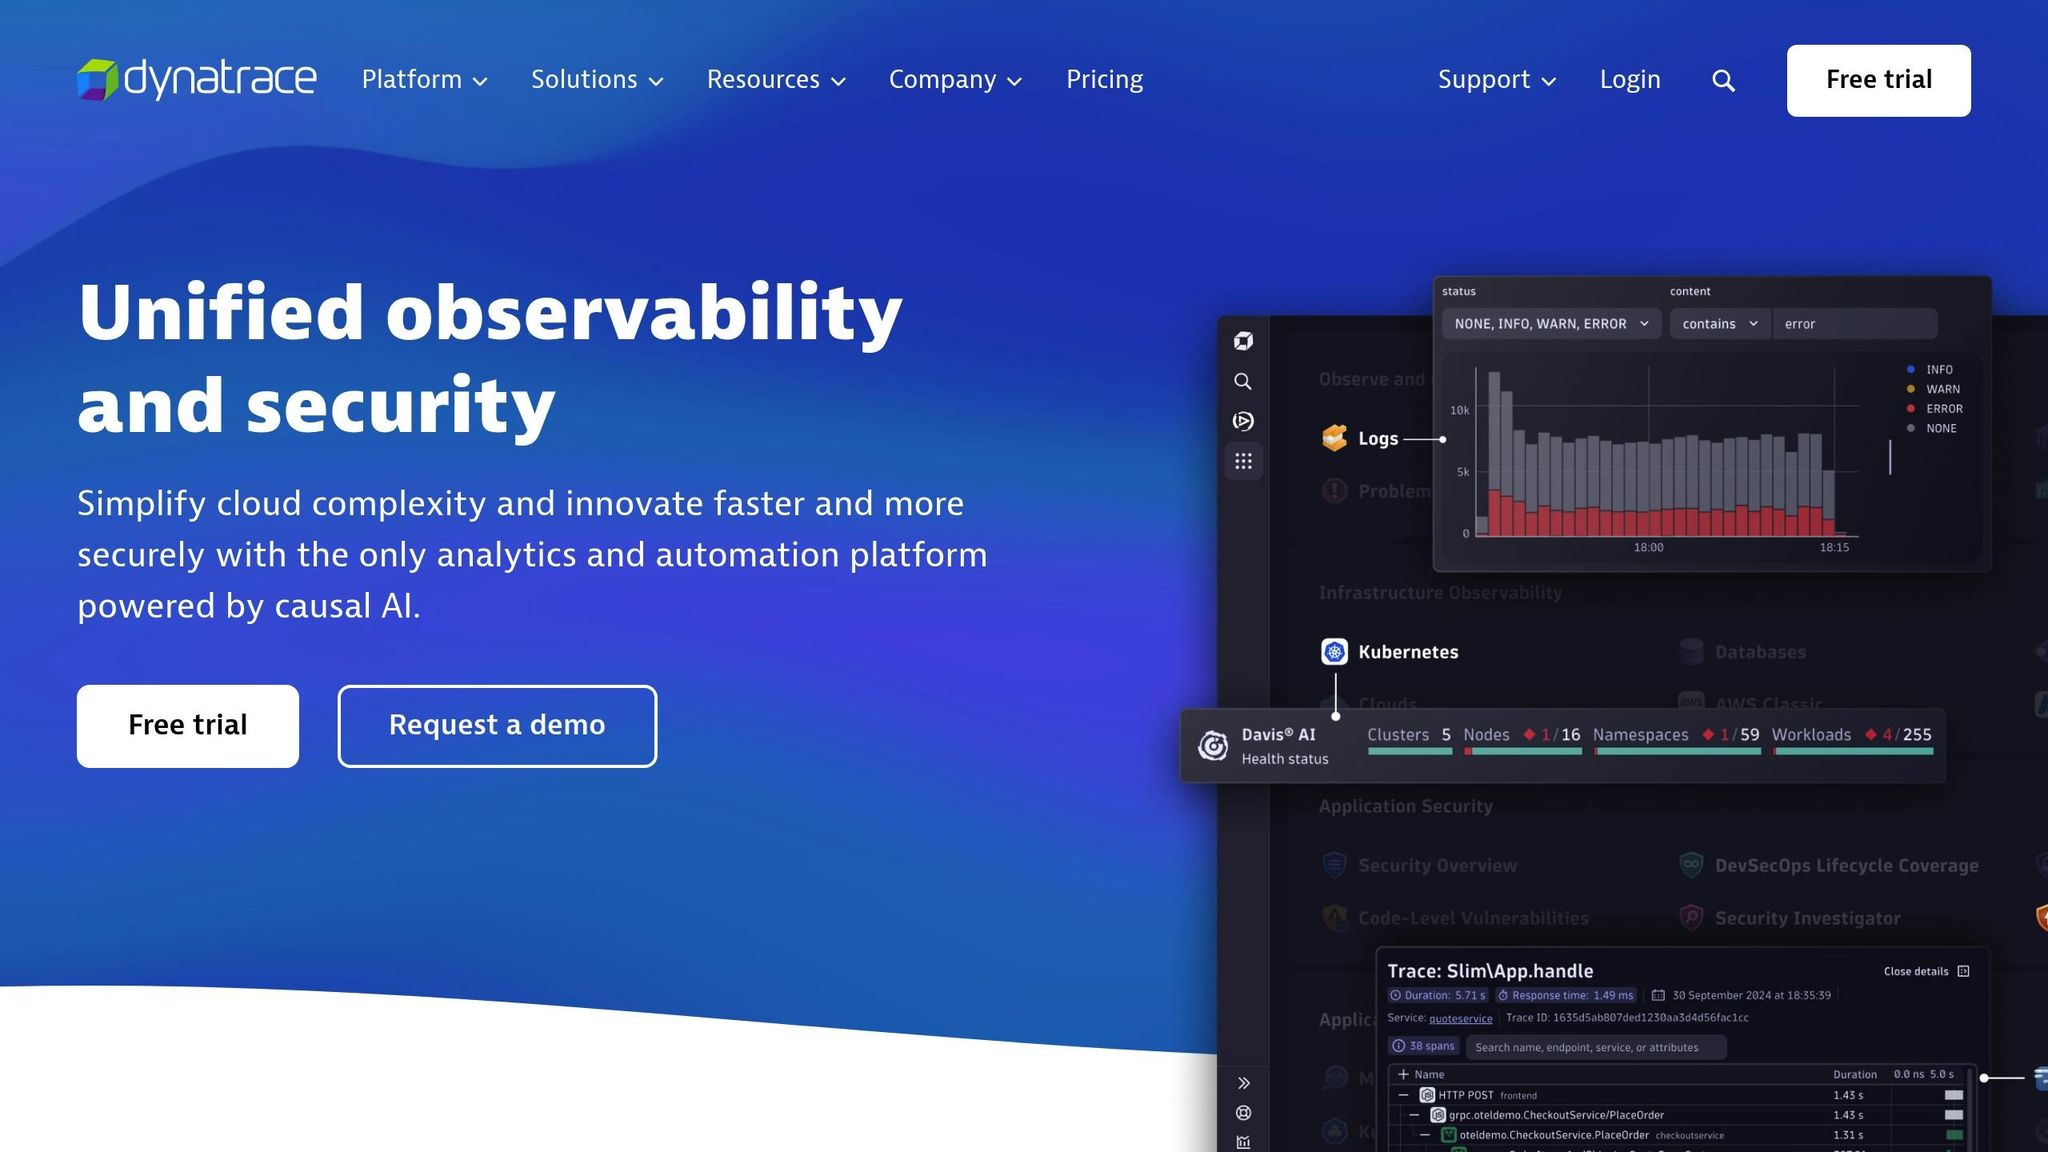
Dynatrace offers AI-driven monitoring across your entire tech stack. Its Davis AI engine handles automated anomaly detection and digs into root causes without manual intervention.
Core Capabilities
| Feature | Description |
|---|---|
| AI-Powered Analysis | Detects problems and identifies root causes automatically with Davis AI |
| Full-Stack Visibility | Monitors everything from VMs to containers and cloud services |
| Real User Monitoring | Tracks user sessions and provides replay functionality |
| Log Analytics | Offers detailed log management with flexible retention options |
| Security Features | Ensures compliance with GDPR, HIPAA, and PCI-DSS standards |
Performance Impact
In one case study, Dynatrace helped reduce the time to detect issues by 70% and cut the time to resolve them by 90%.
Resource Management
The platform combines real-time data with predictive analytics to monitor virtual metrics. This helps businesses plan capacity and make informed decisions.
Pricing Structure
Dynatrace uses a consumption-based pricing model, scaling costs based on usage:
| Monitoring Type | Billing Basis |
|---|---|
| Full-Stack Monitoring | Per hour |
| Real User Monitoring | Per session |
| Synthetic Monitoring | Per request |
| Log Analytics | Per GB ingested |
| Log Retention | Per GB per day |
Enterprise Integration
Dynatrace integrates smoothly with platforms like VMware and Hyper-V. It offers around-the-clock technical support and assigns customer success managers to enterprise clients. This makes it a strong choice for large organizations managing complex virtual infrastructures. However, its consumption-based pricing requires careful tracking to avoid unexpected costs. Next, we’ll take a closer look at Nagios XI and its virtualization monitoring capabilities.
6. Nagios XI
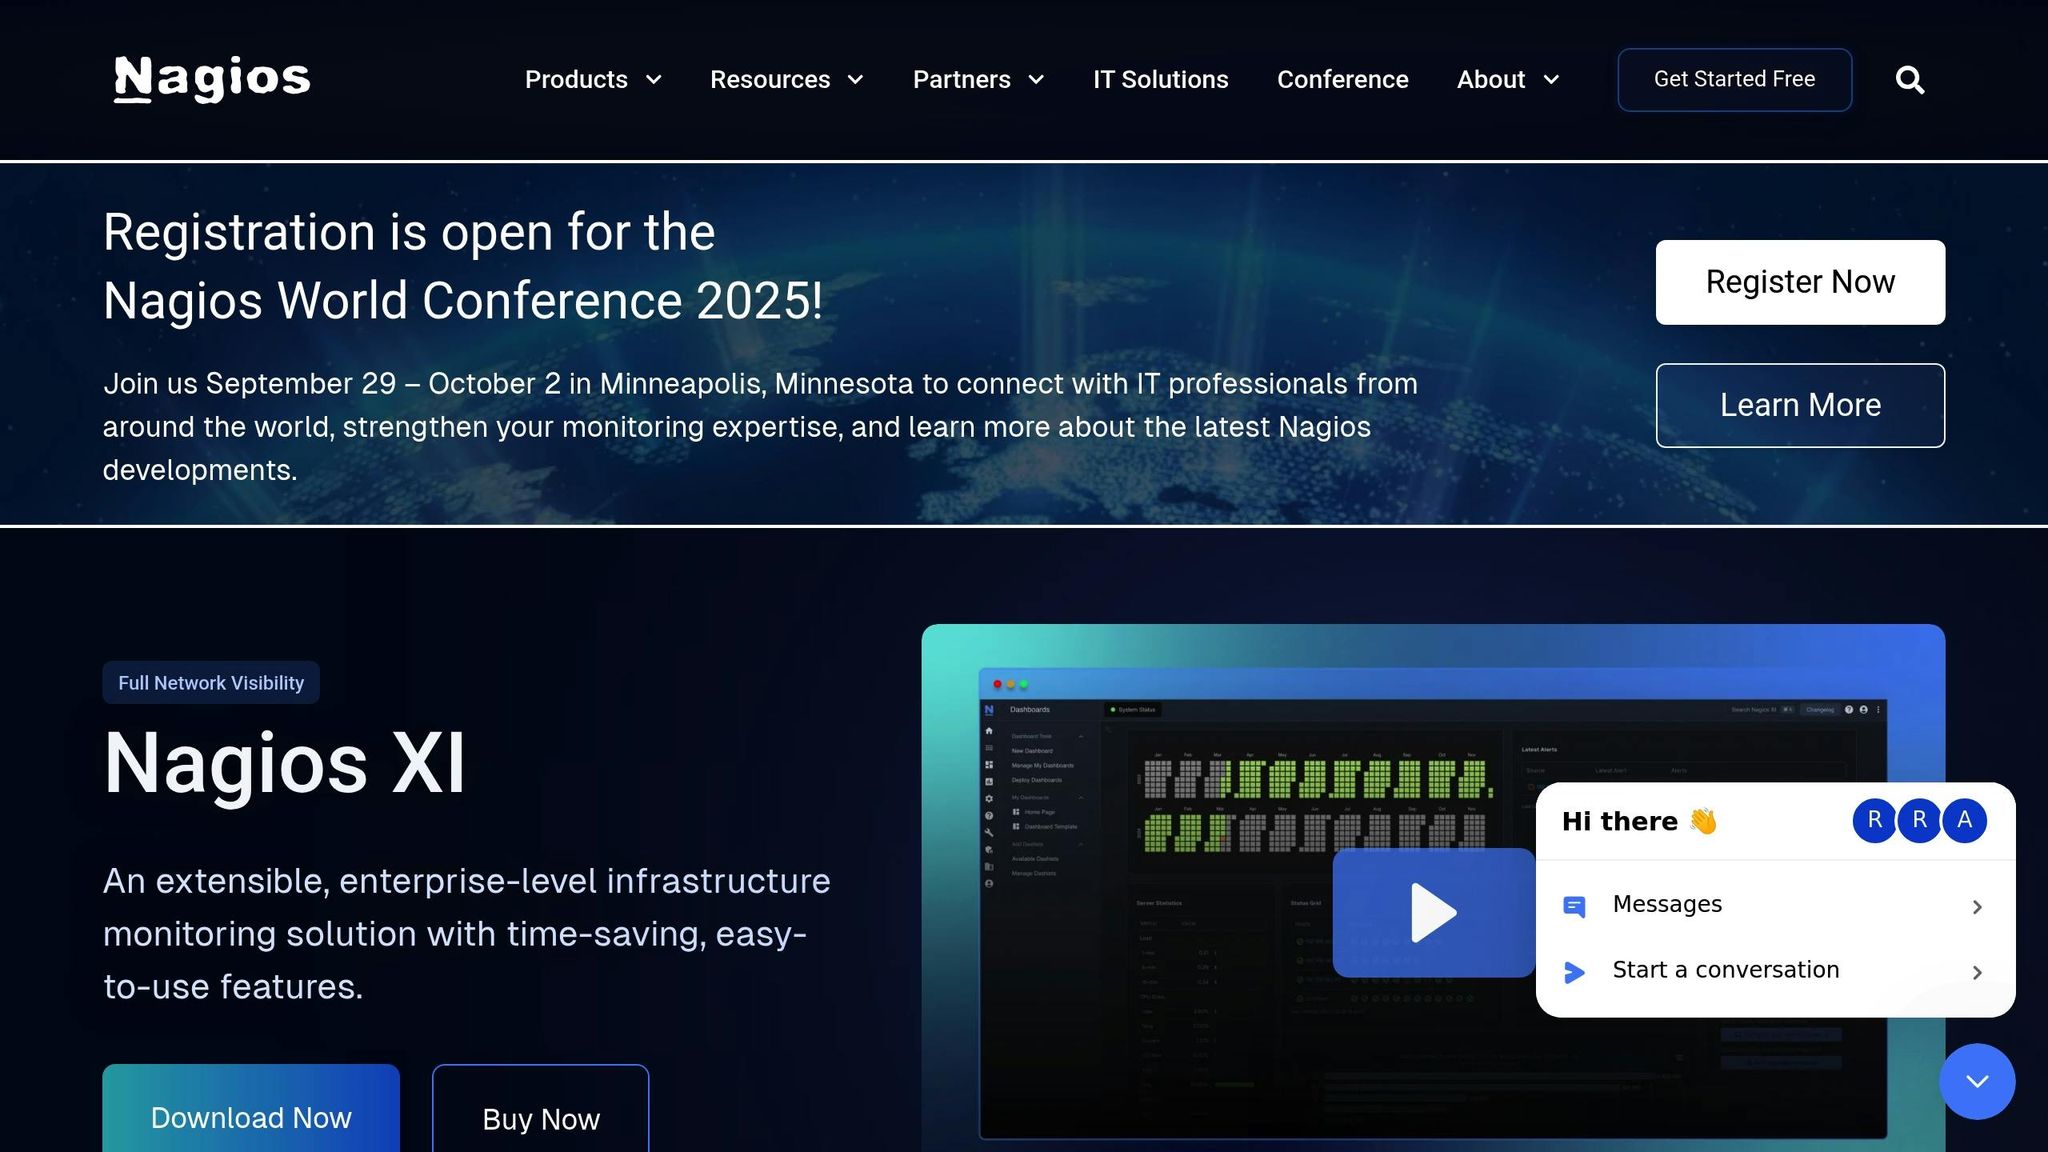
Nagios XI offers a powerful solution for virtualization monitoring, supporting platforms like VMware, Hyper-V, and Citrix.
Core Monitoring Features
| Feature | Description |
|---|---|
| Real-Time Monitoring | Tracks VM performance, host metrics, and key infrastructure components. |
| Distributed Architecture | Handles large-scale environments with ease. |
| Security Controls | Includes role-based access, encryption, and secure authentication. |
| Plugin Ecosystem | Offers a wide range of community-developed plugins. |
| Alert Management | Enables customizable notifications and escalation workflows. |
Enterprise Deployment
Nagios XI supports a variety of deployment setups, whether on-premises, cloud-based, or hybrid. Its distributed monitoring architecture ensures it performs efficiently, even in larger environments. The platform’s deployment options are paired with scalable pricing models to fit different organizational needs.
Pricing Structure
Nagios XI offers flexible pricing based on monitoring requirements:
| Edition | Coverage | Features |
|---|---|---|
| Standard | Up to 100 hosts | Core monitoring features. |
| Enterprise | Unlimited hosts | Includes advanced features and priority support. |
| Free Version | Limited hosts | Provides basic monitoring capabilities. |
The Standard Edition starts at $1,995, covering up to 100 hosts and 500 services. Enterprise pricing adjusts based on the scale of your monitoring needs.
Performance Considerations
Nagios XI is best suited for users with technical expertise. Configuring the platform, especially for complex monitoring setups or custom plugins, can present a learning curve for beginners.
Integration Capabilities
With strong API support, Nagios XI integrates smoothly with other IT tools. This is especially useful for organizations managing multiple monitoring tools or requiring custom reporting solutions.
Supported by a large community and thorough documentation, Nagios XI holds a 4.5/5 rating on Gartner Peer Insights. It’s an excellent choice for organizations ready to utilize its advanced virtualization monitoring features.
sbb-itb-6893d99
7. eG Enterprise
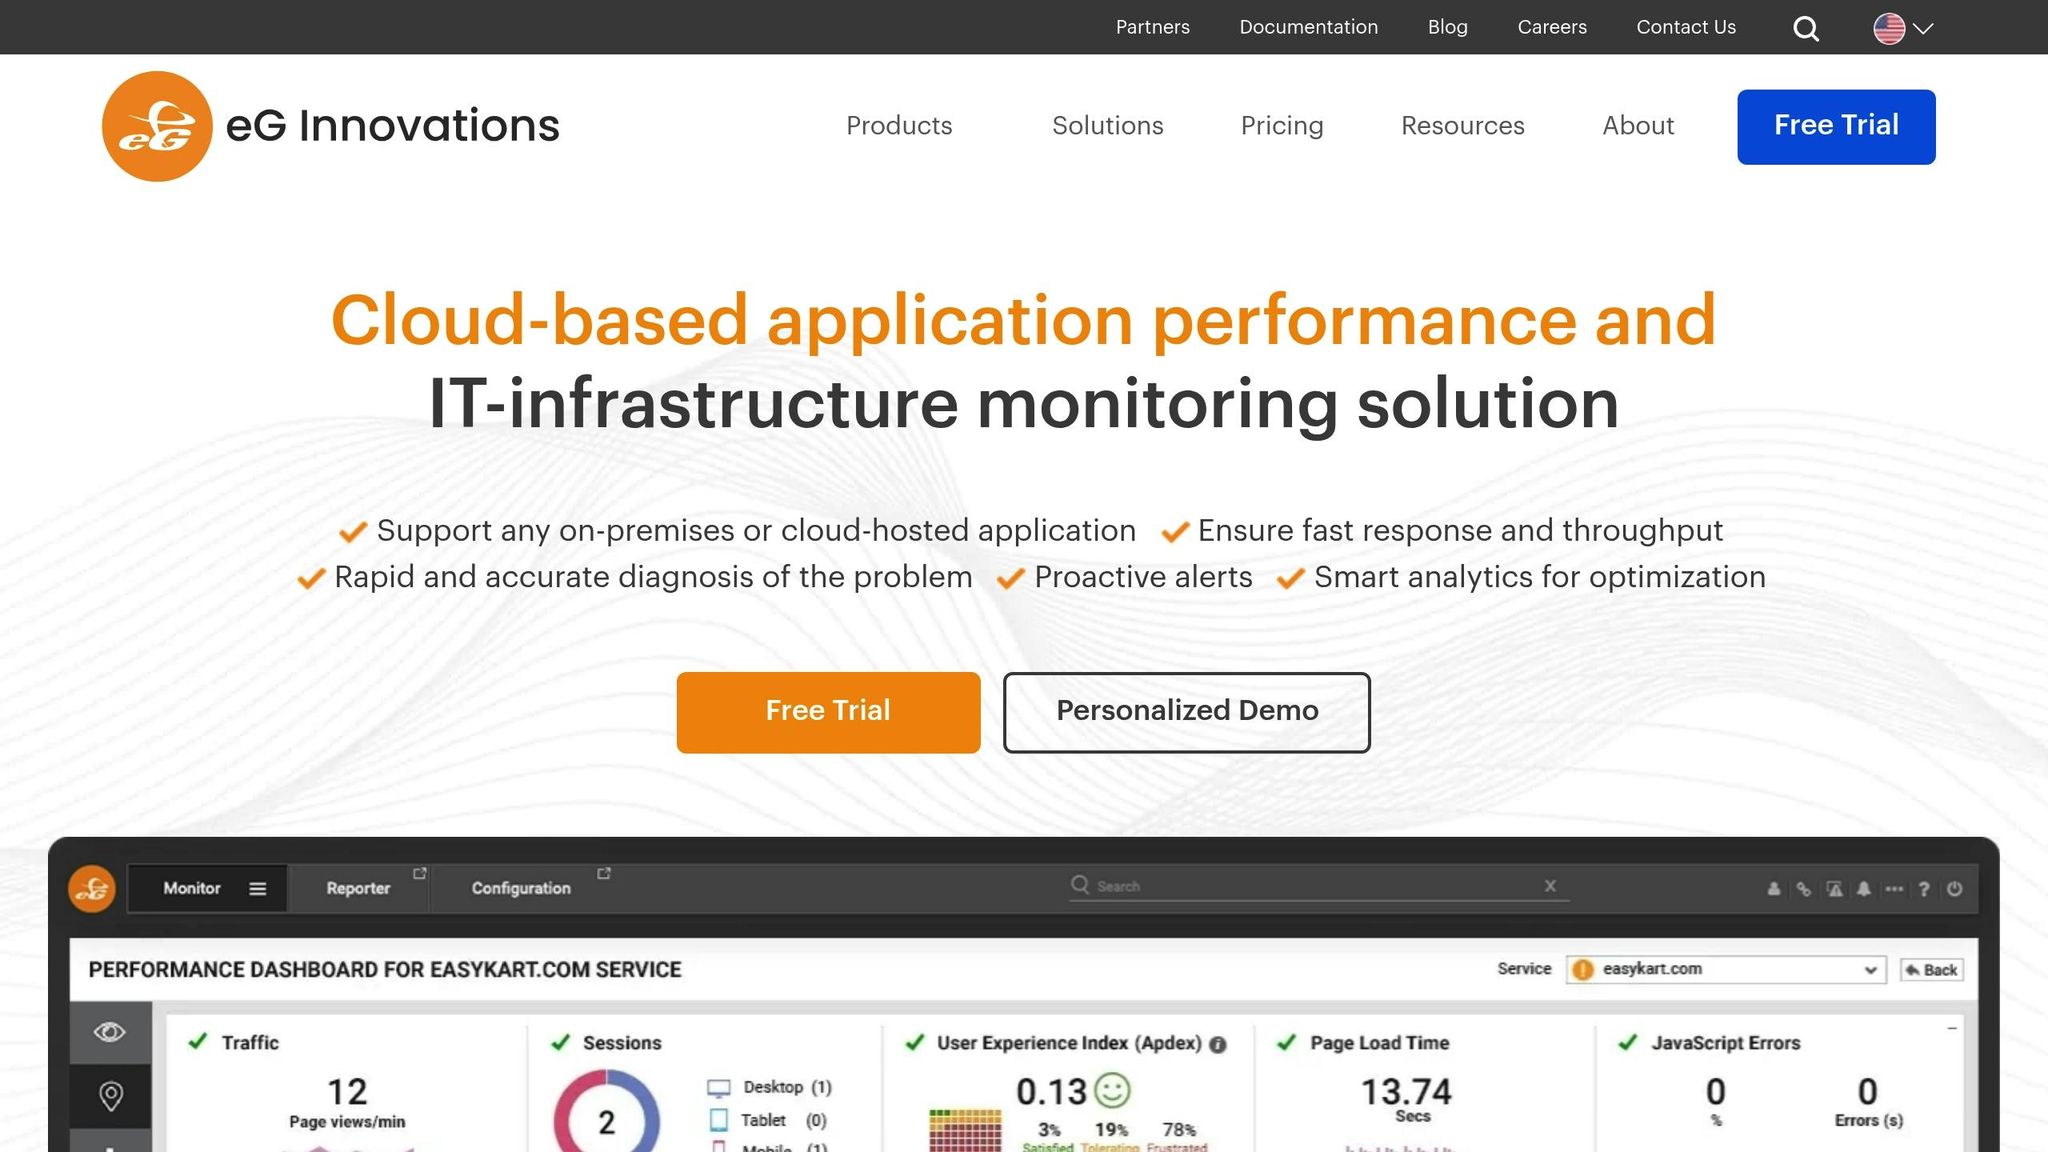
eG Enterprise provides a unified solution for virtualization monitoring, designed to support cloud and data center operations. It works seamlessly with various hypervisors and storage systems, making it a versatile tool for IT teams.
Core Capabilities
| Feature Category | Capabilities |
|---|---|
| Hypervisor Support | Monitors nearly a dozen hypervisor platforms |
| Application Coverage | Tracks performance for hundreds of enterprise applications |
| Storage Monitoring | Compatible with over 20 types of storage devices |
Pricing Structure
eG Enterprise offers pricing plans tailored to meet different needs:
| Plan Type | Starting Price | Features |
|---|---|---|
| Basic Subscription | $100/month | Core monitoring features |
| SaaS Edition | $125/month | Cloud-based deployment with managed services |
| Perpetual License | $10,000 | One-time purchase with lifetime access |
Performance Analytics
One standout feature of eG Enterprise is its ability to perform root cause analysis. By automatically correlating performance data across different layers, it helps IT teams quickly identify and resolve issues in complex, multi-hypervisor environments.
Integration Framework
eG Enterprise enhances its functionality through:
- Direct connections with leading hypervisor platforms
- API integrations with third-party tools
- Built-in features for monitoring storage performance
Technical Considerations
Setting up eG Enterprise can be challenging due to its steep learning curve. Advanced configurations and external tool integrations may require a certain level of technical expertise, especially for organizations with complex environments.
Enterprise Support
The platform provides a range of support options, including detailed documentation, training resources, and access to a community forum. However, initial setup might need additional assistance for optimal use.
eG Enterprise is a solid choice for medium to large organizations seeking in-depth performance monitoring and efficient troubleshooting tools. Up next, we’ll take a closer look at Syskit Monitor to explore more options for virtualization performance management.
8. Syskit Monitor
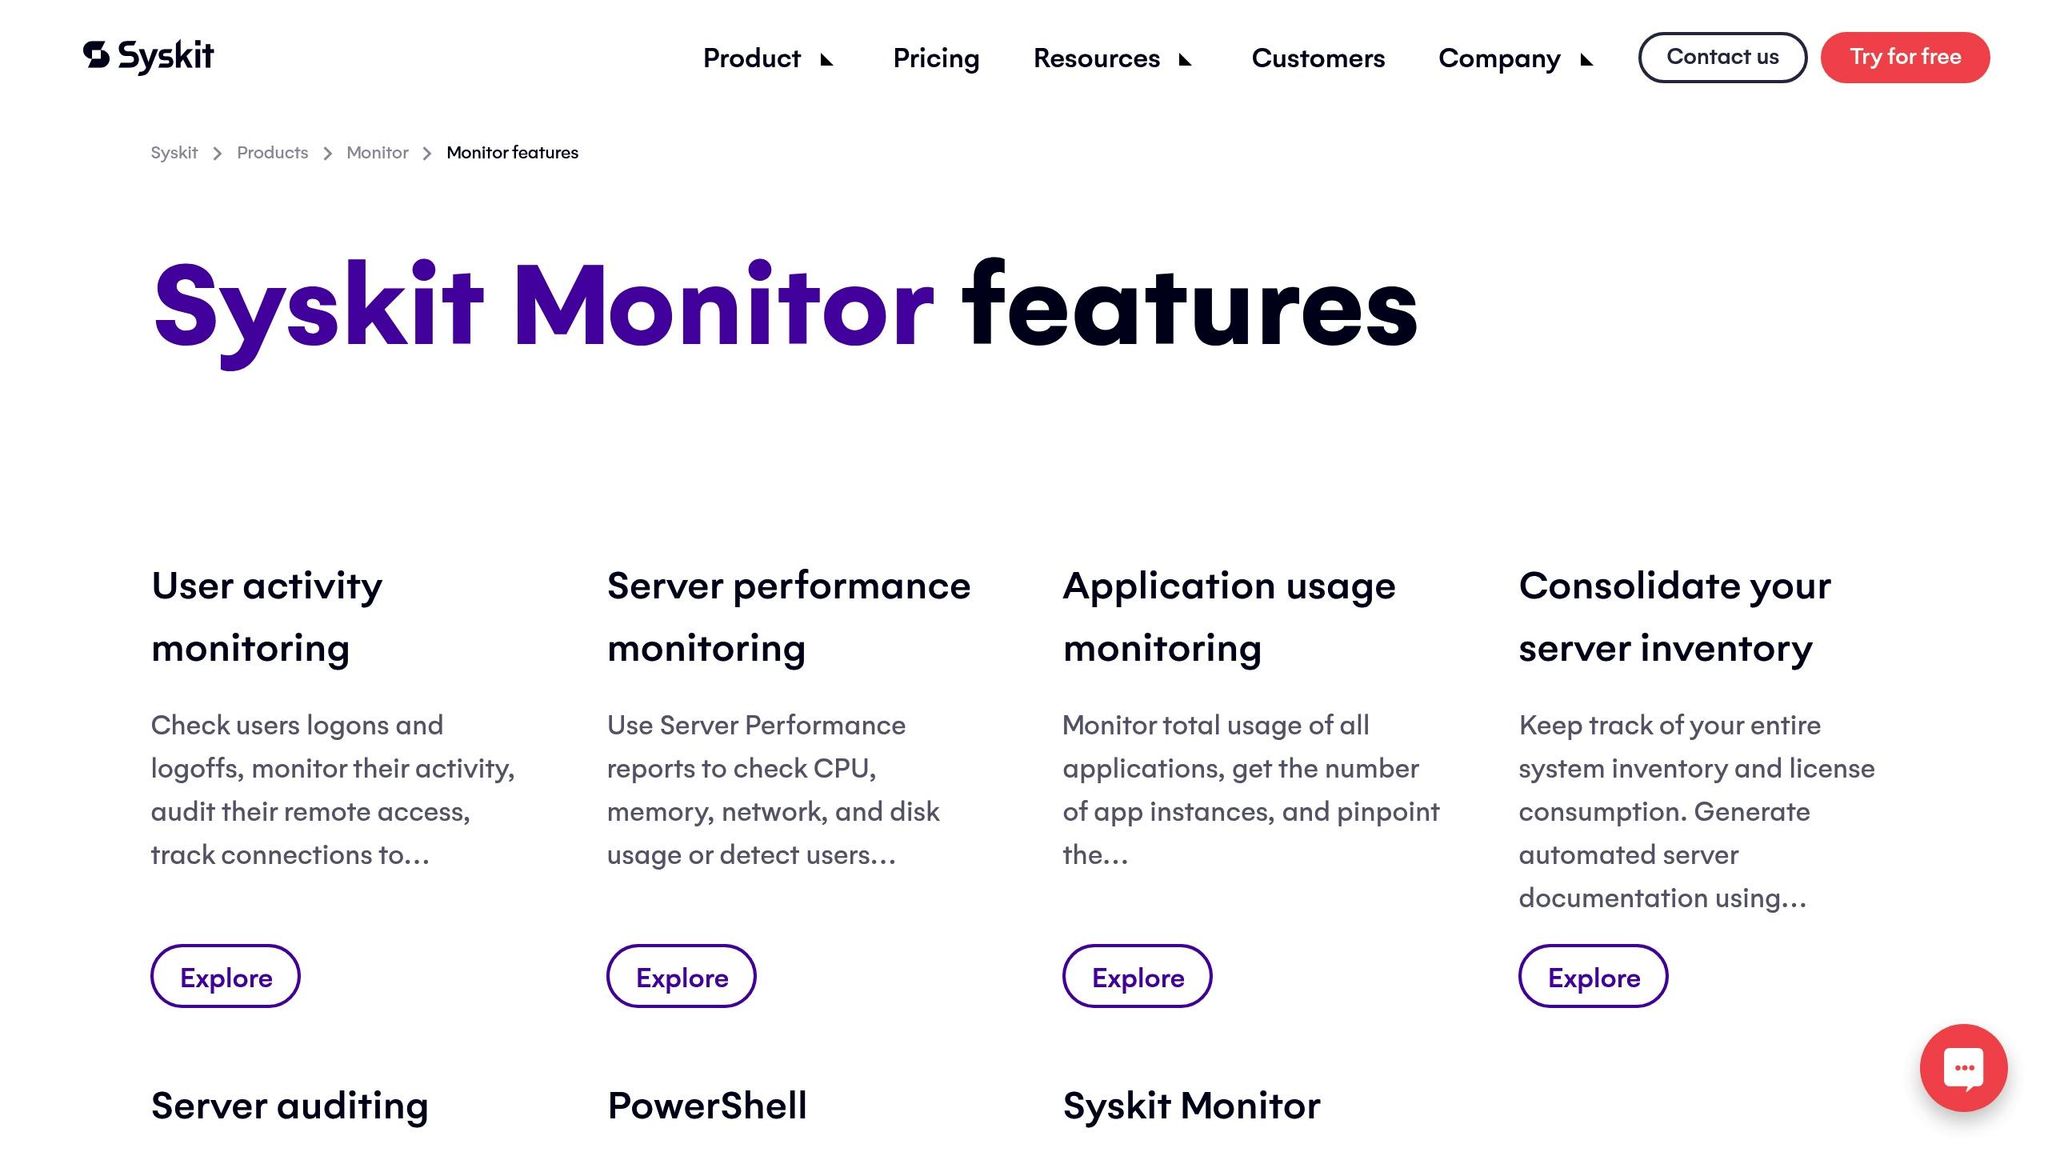
Syskit Monitor is designed to oversee Citrix and Windows virtual desktops, providing detailed insights into user sessions, app performance, and desktop environments. It stands out for its focus on user session analytics, making it a go-to tool for virtualization performance monitoring.
Core Monitoring Capabilities
| Feature Category | Capabilities |
|---|---|
| Virtual Environment | Monitors Citrix Virtual Apps and Desktops, tracks Remote Desktop Services |
| User Management | Tracks sessions, monitors activity, and analyzes resource usage |
| Performance Metrics | Keeps tabs on server health, application performance, and resource usage |
| Security | Monitors access gateways, analyzes user sessions, and generates compliance reports |
Pricing Structure 2025
Syskit Monitor is available in three editions to meet varying organizational requirements:
| Edition | Annual Cost | Best For |
|---|---|---|
| Standard | $359 | Small businesses with basic monitoring needs |
| Professional | $479 | Mid-sized organizations needing advanced features |
| Enterprise | $659 | Large enterprises requiring detailed monitoring |
Technical Implementation
Syskit Monitor integrates seamlessly into existing setups, focusing on monitoring Remote Desktop Protocol (RDP) sessions. This helps IT teams quickly detect and resolve issues, making it an excellent choice for organizations using Windows-based virtual desktops.
Performance Analytics
The tool provides insights into:
- Response times and resource consumption
- Server health and infrastructure performance
- Session trends and resource utilization
Enterprise Integration
With an API-driven structure, Syskit Monitor allows for tailored monitoring setups and supports compliance needs. It’s particularly effective for businesses relying heavily on Citrix environments or requiring detailed user session analysis.
Next, let’s explore Site24x7 and its virtualization performance capabilities.
9. Site24x7
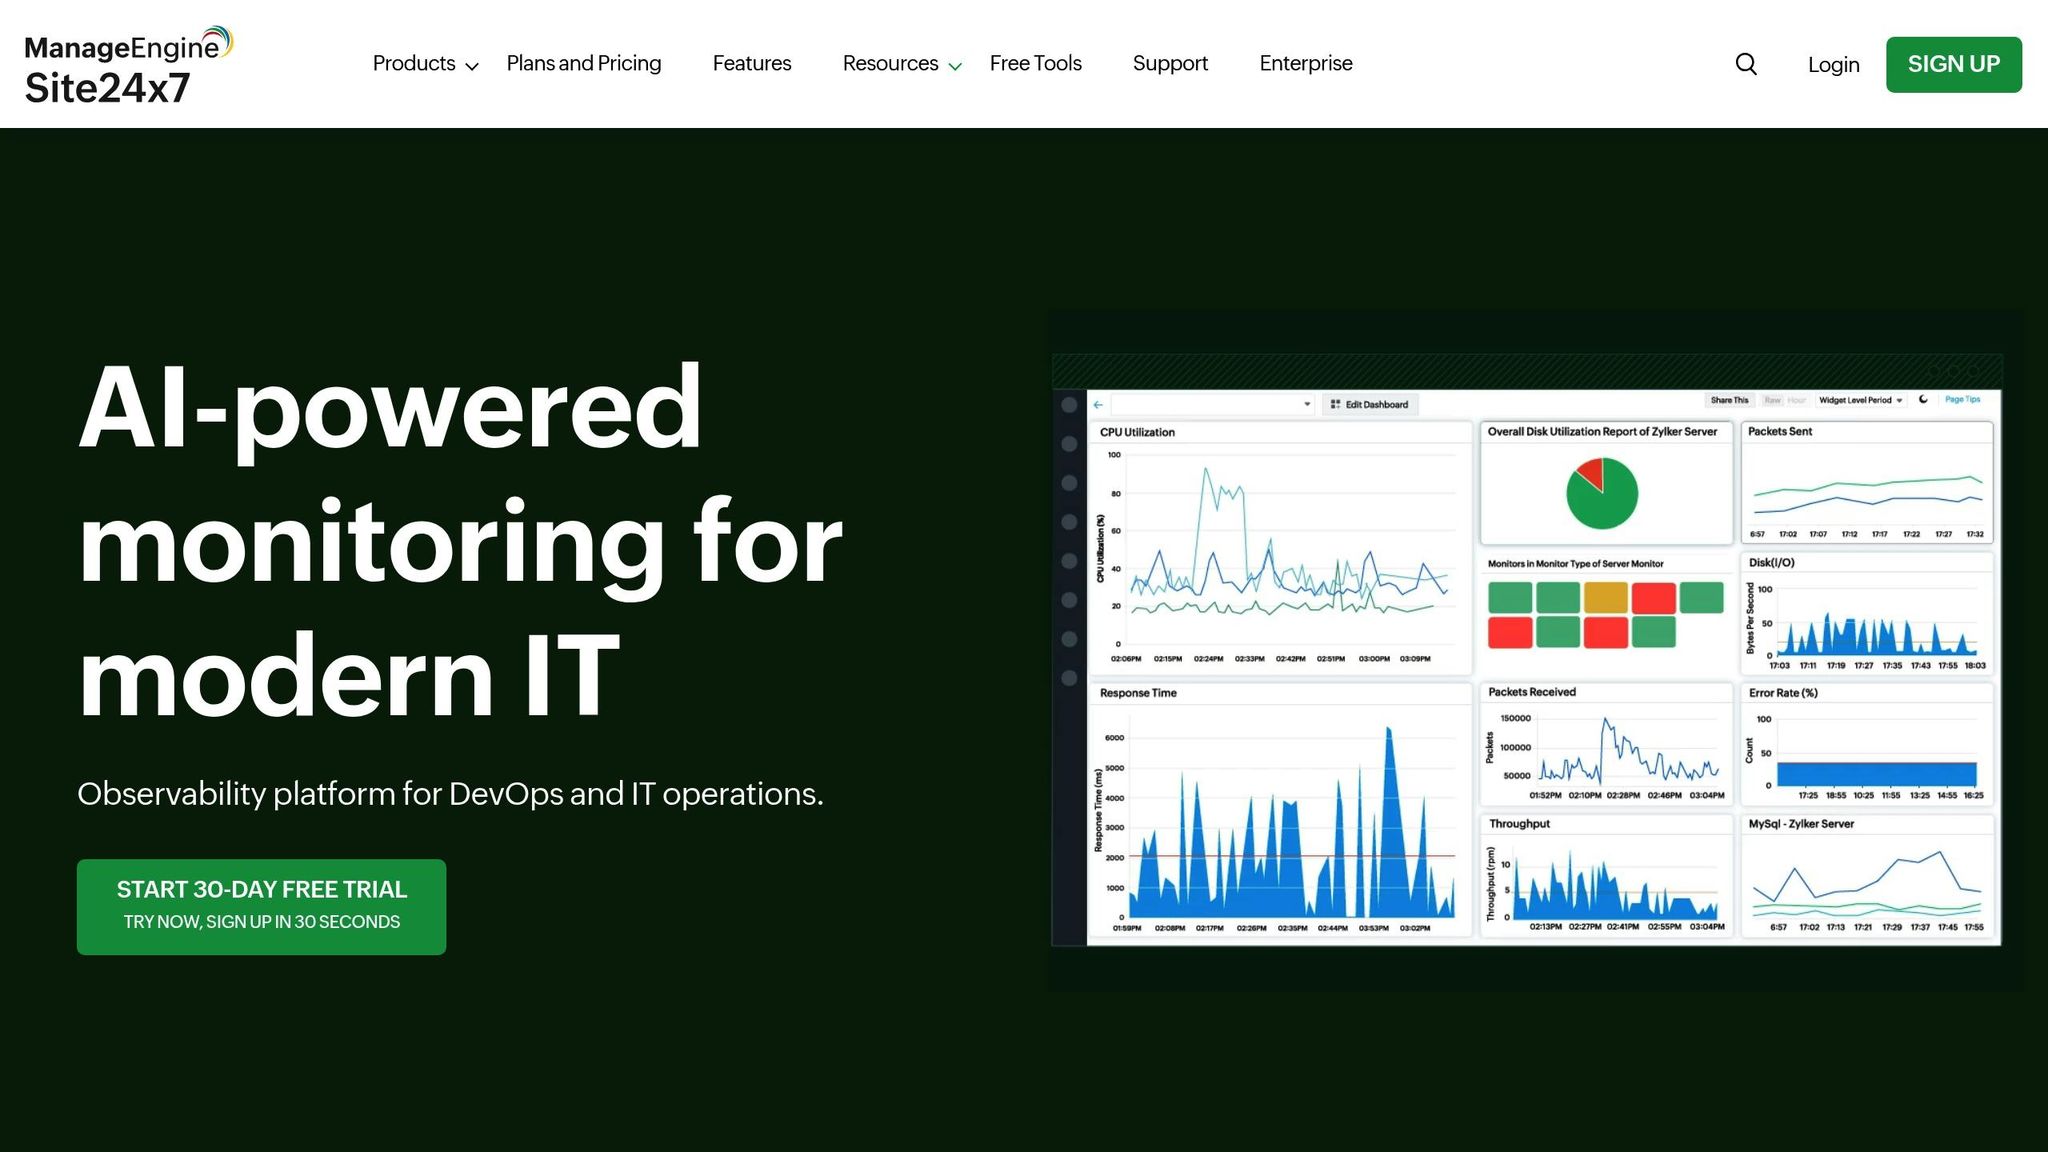
Site24x7, part of Zoho Corporation, is a virtualization monitoring platform designed to track and manage VMware vSphere, ESXi, Hyper‑V, and Citrix XenServer environments.
Key Monitoring Features
| Feature Category | Capabilities |
|---|---|
| Performance Tracking | Real-time metrics, resource usage, and capacity planning |
| AI‑Driven Analysis | Anomaly detection, predictive analytics, and automated fixes |
| Virtual Environment | Monitoring across VMware, Hyper‑V, and Citrix XenServer |
| Alert Management | Custom thresholds, smart alerts, and escalation workflows |
Technical Overview
Site24x7 provides IT teams with a clear view of virtual infrastructure through its AI-powered architecture. It identifies bottlenecks and offers actionable insights, all displayed on customizable dashboards for easy access to critical metrics.
Integration with Enterprise Tools
The platform integrates effortlessly with existing IT management systems and includes robust APIs for custom configurations. Trusted by over 10,000 organizations globally, it offers flexibility and scalability for businesses of all sizes.
Pricing Plans
| Plan | Monthly Cost | Features |
|---|---|---|
| Free | $0 | Basic monitoring for up to 10 monitors |
| Standard | $9/month | Advanced monitoring for up to 10 monitors |
| Professional | Custom | Enterprise-level features with tailored pricing |
Advanced Performance Insights
Site24x7 goes beyond standard metrics by offering tools for resource allocation, trend analysis, capacity planning, and automated issue detection. It holds a 4.5/5 rating on platforms like Gartner Peer Insights and TrustRadius, highlighting its dependability. Its integration with other Zoho products creates a streamlined IT operations management experience.
The platform also includes built-in security monitoring to detect potential breaches and performance issues, ensuring the stability and reliability of virtual environments.
Next, we’ll dive into Zabbix, the final tool in our virtualization monitoring solutions guide.
10. Zabbix
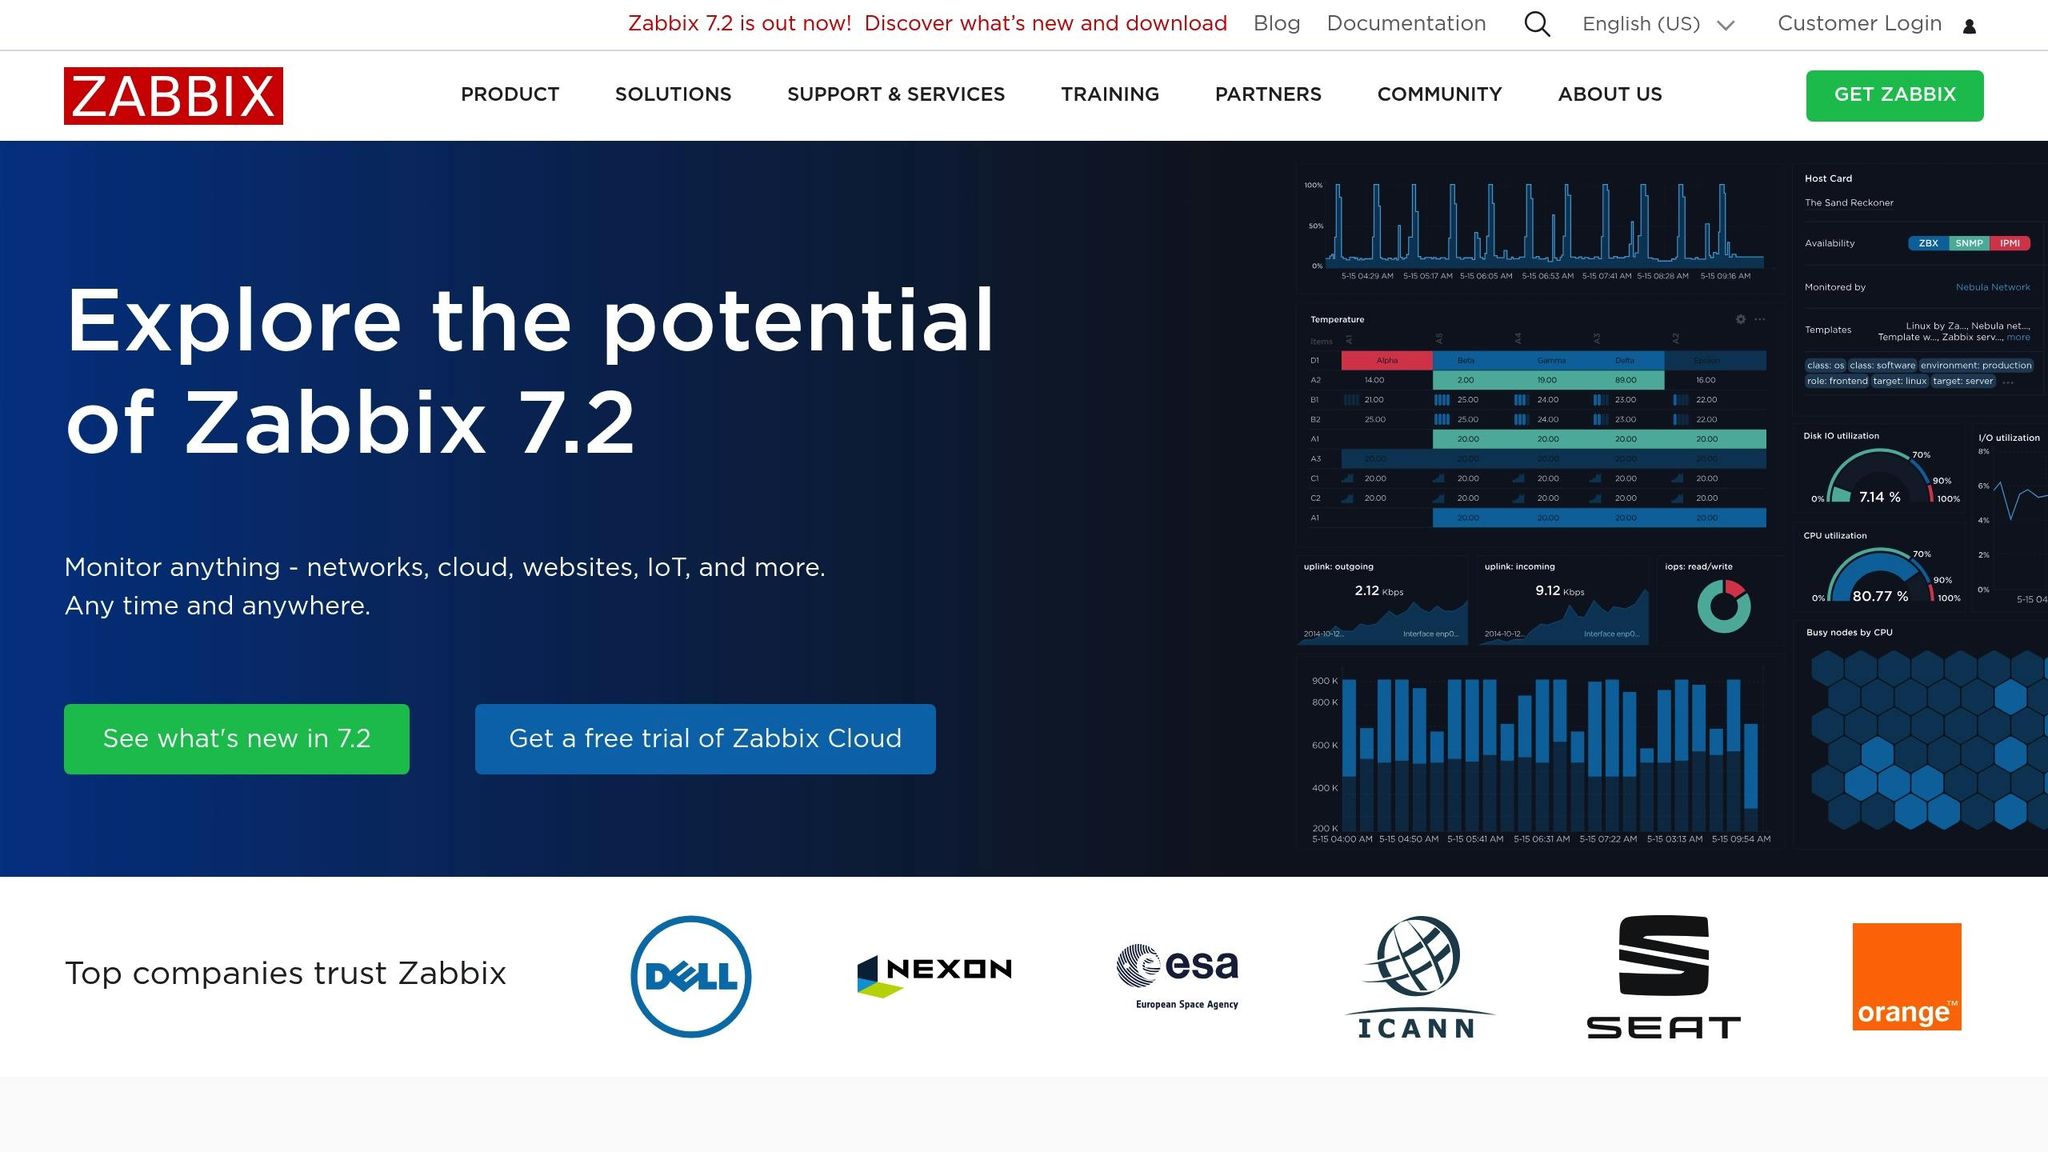
Zabbix is an open-source virtualization monitoring tool used by over 100,000 organizations. It can handle over 100,000 devices from a single server, making it a strong choice for enterprises managing large virtual infrastructures.
Key Monitoring Features
| Feature Category | Capabilities |
|---|---|
| Infrastructure Coverage | Supports VMware, Hyper‑V, and custom virtual environments |
| Monitoring Scope | Tracks real-time metrics, server performance, and network status |
| Alert System | Customizable thresholds with automated notifications |
| Scalability | Monitors 100,000+ devices |
| Integration Options | Works with ITSM systems, CMDBs, and custom APIs |
Technical Implementation
Zabbix provides a library of pre-built templates and customization tools. IT teams can use these templates or create their own scripts to meet specific needs, offering flexibility and control.
Performance Analysis
Zabbix gives detailed insights into virtual machine (VM) performance, resource usage, and network health. It has a strong reputation, with a 4.5/5 rating on G2 and Capterra based on over 1,700 reviews from IT professionals.
Cost Structure
Zabbix’s open-source model eliminates licensing fees, offering two main options:
| Service Type | Cost | Support Level |
|---|---|---|
| Community Edition | Free | Access to forums and detailed documentation |
| Enterprise Support | Custom pricing | Professional technical support |
Advanced Capabilities
Zabbix enables real-time server tracking, detailed network monitoring, and customizable dashboards. It also integrates with ITSM systems and configuration databases, making it a flexible, cost-efficient solution for virtual environments.
Implementation Considerations
Though powerful, Zabbix has a steeper learning curve compared to some commercial tools. IT teams with open-source experience will find it easier to set up, but its thorough documentation and active community help reduce the complexity. For organizations needing a scalable and budget-friendly monitoring solution, Zabbix is a strong contender.
Tools Comparison Chart
Here’s a breakdown of top virtualization monitoring tools for 2025, highlighting key features, scalability, and integration options that IT teams prioritize.
Core Features Comparison
| Tool | Platforms Supported | Real-Time Monitoring | Alerts | Scalability | Integration Options |
|---|---|---|---|---|---|
| NinjaOne | VMware, Hyper-V | Yes | Customizable | Medium | ITSM, Cloud Services |
| ManageEngine OpManager | VMware, Hyper-V, Citrix | Yes | Advanced | Large | ITSM, CMDB |
| New Relic | VMware, Cloud VMs | Yes | AI-powered | Enterprise | APM, Cloud Services |
| SolarWinds VM | VMware, Hyper-V | Yes | Customizable | Large | ITSM, Cloud Services |
| Dynatrace | Multi-platform | Yes | AI-driven | Enterprise | Full-stack |
| Nagios XI | VMware, Hyper-V, Citrix | Yes | Standard | Large | Custom APIs |
| eG Enterprise | All major platforms | Yes | Advanced | Enterprise | ITSM, APM |
| Syskit Monitor | Hyper-V focused | Yes | Basic | Medium | Microsoft Stack |
| Site24x7 | Multi-platform | Yes | Advanced | Large | Cloud Services |
| Zabbix | All major platforms | Yes | Customizable | Enterprise | Custom APIs |
Implementation Requirements
Choosing the right tool depends on your organization’s size and specific monitoring needs. Here’s a quick guide to help:
| Organization Size | Recommended Tools | Key Requirements |
|---|---|---|
| Small Business (<100 VMs) | NinjaOne, Syskit Monitor | Basic monitoring, budget-friendly options |
| Mid-size (100-1000 VMs) | ManageEngine OpManager, SolarWinds VM | Scalable tools with broader monitoring |
| Enterprise (1000+ VMs) | Dynatrace, Zabbix, New Relic | High scalability, advanced capabilities |
For enterprises, tools like Dynatrace and New Relic provide AI-powered monitoring with advanced analytics, while Zabbix offers extensive customization for those seeking open-source solutions. If your focus is on Hyper-V environments, Syskit Monitor is tailored to meet those needs.
Use this chart to explore the best fit for your setup before diving into detailed recommendations.
Final Recommendations
Based on the feature comparison above, here are specific suggestions tailored to different organizational sizes and needs:
For Small Businesses (Under 100 VMs)
If you’re running a smaller operation, NinjaOne and Syskit Monitor are great choices for straightforward monitoring. For example, Syskit Monitor’s Standard Edition costs $359 annually and offers an easy-to-use solution for monitoring Microsoft environments.
For Mid-Size Organizations (100-1000 VMs)
Mid-size organizations often need a balance between features and affordability. ManageEngine OpManager starts at $245 for its Standard Edition and offers a solid mix of features. If you’re looking for something with pre-configured templates for a quick setup, SolarWinds Virtualization Manager is an excellent option at $1,813.
For Enterprise Environments (1000+ VMs)
For large-scale operations, Dynatrace and New Relic provide advanced, AI-driven monitoring tools. Their offerings include:
- Complete visibility from infrastructure to applications
- AI-powered detection to address issues before they escalate
- Seamless integration with enterprise tools
For Budget-Conscious Organizations
If you’re looking to cut costs without sacrificing functionality, Zabbix is a strong contender. It’s an open-source solution that delivers enterprise-level monitoring, with plenty of customization options and no licensing fees.
Special Use Cases
- Citrix environments: If your organization relies on Citrix virtual apps and desktops, Syskit Monitor’s Professional Edition is specifically designed for this purpose.
- Multi-platform setups: For businesses using multiple virtualization platforms, eG Enterprise offers native hypervisor support across the board.
- Network-focused needs: If network monitoring is just as important as virtualization, ManageEngine OpManager is a great dual-purpose tool.
When choosing a solution, consider how well it fits with your existing technology stack. For instance, Microsoft-heavy organizations will benefit from Syskit Monitor’s tight integration, while cloud-first companies might lean toward New Relic or Site24x7 for their cloud-friendly features.
FAQs
What is Hyper‑V monitoring?
Hyper‑V monitoring focuses on managing Microsoft’s Hyper‑V environments. It keeps an eye on key performance metrics like CPU usage, memory consumption, disk space, and network traffic for virtual machines (VMs) and their host servers in real time. The goal? To ensure your system runs smoothly by tracking performance, managing resources, and catching issues early.
Tools like ManageEngine OpManager are designed specifically for Hyper‑V monitoring, offering features to track multiple performance metrics across your virtual setup.
When choosing a Hyper‑V monitoring tool, look for features like:
- Real‑time performance dashboards to quickly check system health
- Automated alerts to flag potential problems
- Resource tracking to improve VM placement and avoid bottlenecks
These tools help reduce risks and keep your system stable.


